
Emotion Recognition in Smart Store
Integrate Emotion Factors to Facilitate Recommender System

Aiming at providing better in-store experience, I proposed and validated the methods of integrating emotion recognition to support decision-making. According to the results of literature review and user research on consumer shopping preferences, I designed and performed emotion induction experiment to study the relationship between emotions and consumers’ preferences. I designed various sampling strategies to analyze facial expression data as well as chooses the best input features of the training set for the classifiers. Finally, the classifier with the optimal accuracy is selected and used to study the relative preferences of attributes under different emotion intensity.
The results show that emotion could be a critical factor to implement recommender system in smart store. By adding emotion factors into recommender, I successfully raised the accuracy by 29%.
My Role:
UX researcher, data scientist
Scope:
Literature Review, User Research, Experiment, Sampling Strategy, Data Analysis
Project of Chinese Academic of Sciences(CAS), Tsinghua Undergraduate Thesis
Research Background
Retail industry is growing rapidly in China. The market size exceeded 27 trillion Chinese Yuan (approx. 4.1 trillion USD). Although e-commerce was pushing back all traditional offline retailers, they still kept a huge market share. As more technologies are integrated into offline shopping malls (e.g. RFID, AR/VR, iBeacon), offline stores are trying to make the change happens. The changes typically fall into following categories:
- Cooperate with e-commerce to expand their reputation
- Use smart devices, or push notifications to consumers' devices
- Collect and analyze consumer data to determine patterns
- Use technologies (e.g. IoT) to re-design shopping experience
My design mainly focused on chain-operated convenient stores. Compare to some developed areas, the number of convenient stores will definitely grow in order to satisfy the growing consumer needs.

Target consumers were narrowed to people who work in high-density business area or in high-tech industry. These people are believed to have advanced academic degrees, higher life standard, and strong curiosity toward technology. In addition, the population flow rate is relatively low since they usually have stable jobs.
Research Goals
- To reveal the features of our target consumers
- How does every factor that may appear during shopping affect the way consumers make decision?
- What are common attributes that consumers consider when making purchasing decision?
- To establish the relationship between emotion intensity and consumer preferences
- How to determine the influence of a specific attribute?
- How to acquire emotion data in real time and how to perform accurate prediction?
Research Framework
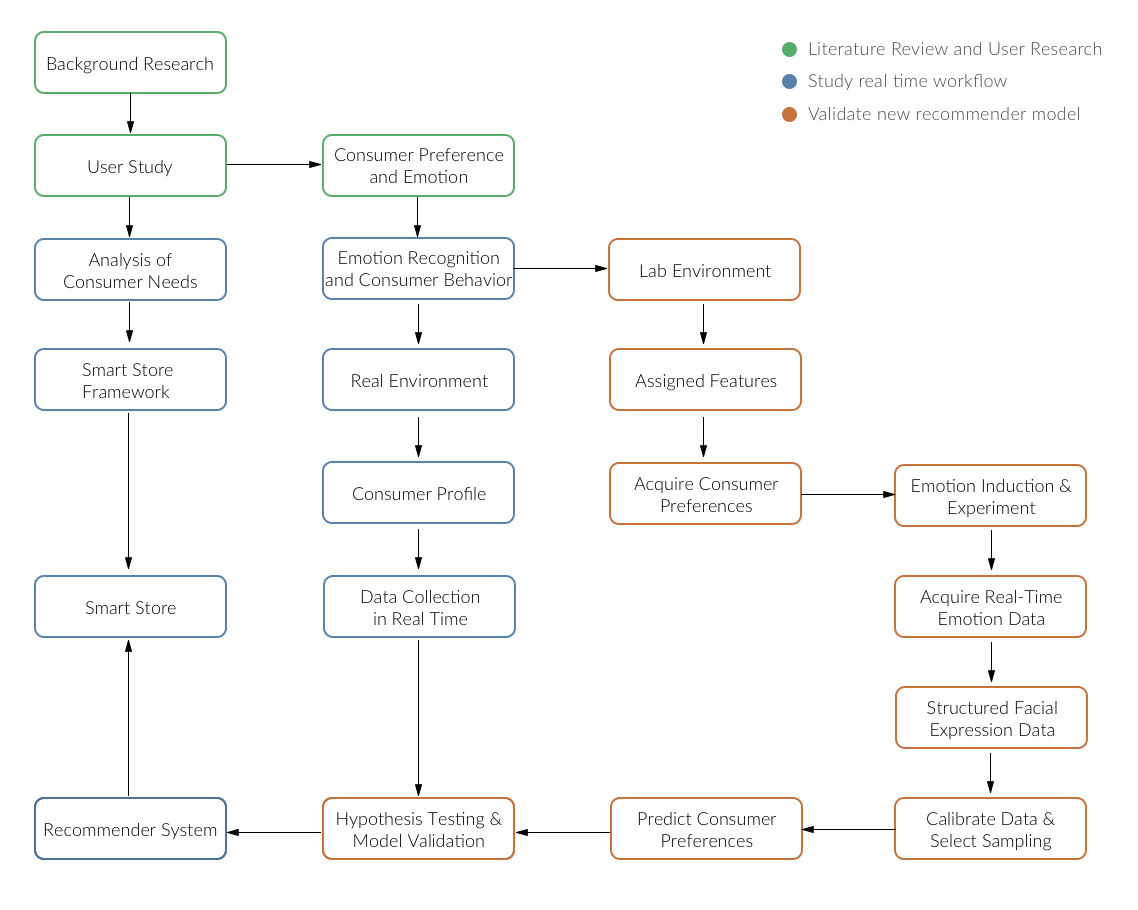
The classifier model will be used to support current recommender system
User Research
I managed the research team to study consumer preferences. In the research, I conducted focus group, leading a group of 5 people discuss their shopping experience. Also, I designed and ran a survey about consumer preference to validate the data I collected in the focus group.
All interviewee involved were in high-tech or financial industry in City of Qingdao, Shandong. In this semi-structured discussion, I covered the following topics:
- Walk me through your work yesterday. How does your workload affect your daily life?
- How to spend your spare time at work?
- What do you get for meals?
- What attributes do you care when purchasing drinks and foods?
- What attributes do you care when shopping online?
- How does other people's opinions affect you? Will you adopt their recommendation?
- Have you ever been influenced by your emotion? How did it change your mind?
Afterward, I used personas to show our typical users.


By combining the result from focus group and survey, I derived and aggregated several attributes, and used them in the emotion induction experiment. In a typical convenient store, foods and drinks are the majority. In addition, most of them are relatively common in people's daily life.

The attributes people addressed in the user research part will be used to predict their preferences because people care about these attributes of goods in convenient stores.
Experiment Design
Experiment Process:
- Study consumer preference to each attribute or groups of attributes under different emotion level
- Collect a large amount of data in a short experiment time as the training set
Experiment Process:
- Subject fills a questionnaire regarding his/her personal profile, as well as signs the contract
- Subject is exposed to a group of emotion induction materials
- Subject fills a questionnaire regarding his/her subjective emotion level
- Subject rates his/her preference to different attributes
- Subject has a 2-minute break, and goes to the next emotion induction experiment.
Factors & Levels:
Depending on the category of goods, I designed different factors as consumers have different interests in the attributes. For each factor (attribute), I set two levels: high and low.

Experiment Tasks
The subject will fill a questionnaire first. The data gets all demographic information, as well as explains possible drifts in the final result. Typical data collected includes gender, age, BMI, and personal preferences.
The subject will go through a series emotion induction materials first. According to Microsoft's Cognitive Services (Emotion API), emotions are classified as 7 categories: neutral, anger, sadness, fear, disgust, happiness, and surprise. However, in real use-cases, it is hard to detect emotions in such detailed levels to form effective predictions. Also, there is few research that supports inducing such subtle emotions. Therefore, in this research, I induced neutral, negative, and positive.

I used combined induction methods (Velten's method + Video) in this experiment. For each induction experiment, subject is required to read through several sentences and imagine their personal experiences. Afterward, subject will watch a video clip (about 180 seconds). The subject will rate current emotion intensity using Likert scale after watching it. All the experiments were recorded by camera for the purpose of facial expression analysis afterward.

It is not reasonable to ask subject to rate each attributes respectively because that contradicts the way of people's mental model. Also, rating each items makes no sense since this research aims at revealing the relationship between emotions and preferences to attributes. Hence, I converted attributes to the differences of attributes, and constructed full factorial design. Subject is required to compare between two items according to their normal behaviors, and items stand for different attribute levels. Under this circumstance, the preference of item may indicate the preference of certain attributes.

Experiment Interface: Subject rates the item. 1 stands for absolutely item A, 7 stands for absolutely item B, and 4 suggests no preference.
Sampling Strategy
Justification
Subjects reflected a huge success in emotion induction. According to subjective emotion intensity rating, for example, when negatively induced, subjects reported significantly intense negative emotions.

Effective Emotion Induction
Hypotheses
For our sampling strategy and further analysis, I made the following hypotheses:
- The emotion indicated by facial expression data should comply to the emotion that subjectives reported
- The sampling process should result in high accuracy but low computing load
- The sampling strategy should fit the pattern that people make purchase decision
Process
The process of analyzing facial expression data is depicted as follows:

The above process returned structured emotion vectors, and each element in the vector indicates the probability of possessing that emotion. To get the overall subject's emotion levels, I designed four sampling strategies:
Strategy 1: Continuously Sampling with Exponential Smoothing

Keep the influence of history data
Strategy 2: Continuously Sampling with Maximum Emotion Probability

Effectively reflect the intensity of emotion, but tedious to avoid outliners
Strategy 3: Continuously Sampling at Global Maxima

Effectively reflect the intensity and duration of emotion, but consume computation resource and storage resource
Strategy 4: Random Sampling wth Normalization

Low resource consumption, but weak model interpretability
The research goal at this step is to determine which is the optimal strategy to best fit the subjective emotion levels. I used BP neural network to map from objective emotion levels to subjective emotion levels. The one with the minimum error should be the optimal one. As is shown in the following diagram, strategy 3 is the best sampling strategy.

Error of each BP network
Classifier & Prediction
Goal: Select the best classifier and its parameters to best predict the purchase choice
According to multiple experiments, I defined the number of features as 10. And since the number of features are small, simpler classifier may be more efficient.
- 463 instances, 10 predictor variables and 1 response variable
- Predictor variables: [Neutral, Happiness, Sadness, Anger, Calories, Price, Common, Appearance, Gender, BMI]
- Response variable: {Purchase}
- 5-fold cross validation

I took the strategy with the highest accuracy for further analysis. Strategy 3 with calibration was the best, and its interpretability is higher than strategy 4. Also, compared to the control group (no emotion elements in the predictor variables), taking emotion factors into consideration raised the accuracy by 26%. We may conclude that for the foods and drinks category the best fitting method is decision tree, which achieve almost 80% prediction accuracy.


Similarly, I performed the above analysis to fit the non-food category. The results showed that strategy 3 is still the best one. We may conclude that for the non-food category the best fitting method is support vector machine, which achieve 83% prediction accuracy.


Conclusion

Research Process:
- User Research: User preferences, and experiment factors selection
- Experiment Design: Mapping emotions to attributes preferences, and collecting data for machine learning
- Data Analysis: Significant induction results, determining the optimal sampling strategy, and analyzing the model
Visioning:
- Quantitative mapping between emotion intensity and consumer preferences
- The integration and deployment of emotion recognition system
- Improving current recommender system